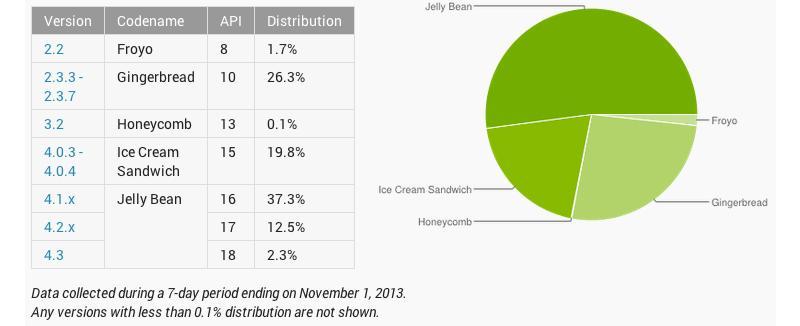
We've officially entered November! Know what that means? It's also time to check the Android platform distribution numbers! These stats show which versions of Android are running on the devices that've checked into the Google Play Store app in the seven-day period ending on Nov. 1, giving developers and other curious parties an idea of how widely used each version of the platform is.
First up on Google's dessert tray is Jelly Bean, which was present on a total of 52.1 percent of devices surveyed. That's a slight jump from last month, when Android 4.1-4.3 was present on a total of 48.6 percent of devices. Meanwhile, Android 4.0 Ice Cream Sandwich was being used on 19.8 percent of hardware, down from 20.6 percent last month.
Moving into the pre-4.x versions of Android, we've got Android 3.2 Honeycomb, which has been holding steady with a 0.1 percent share for a few months now. Android 2.3 Gingerbread finished the seven-day survey period with a total share of 26.3 percent and Android 2.2 Froyo was present on 1.7 percent of devices, both of which are lower than the 28.5 percent and 2.2 percent totals that those versions posted in October.
Overall there's nothing terribly shocking to be found in this latest round of Android distribution stats. Jelly Bean adoption has continued to grow thanks to releases of new hardware like the Galaxy Note 3, while older versions of Android lose market share due to consumers receiving software updates and upgrading to new devices.
As expected, Android 4.4 KitKat is nowhere to be found in these numbers since it's only officially available on the Nexus 5 that was announced earlier this week. With new orders of the Nexus 5 not shipping for several weeks and promises of prompt KitKat updates for the HTC One, though, it'll definitely be interesting to see what type of distribution numbers that Android 4.4 puts up in the first couple of months that it is a part of these stats.