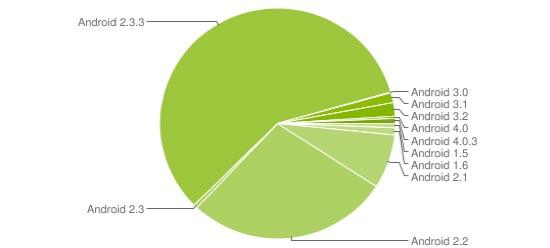
It's that time of the month once again, folks: time to take a look at the distribution of the different versions of Android on devices accessing the Market! As usual, this data is based on the number of products that accessed the Android Market during a two-week period, this time with said period ending on February 1st. The first number that most folks notice is the Ice Cream Sandwich share, which shows that Android 4.0-4.0.3 is now present on one percent of all devices. The tablet-specific version of Android, known as 3.0 Honeycomb, appeared a total of 3.4 percent of devices. Unsurprisingly, Android 2.3 Gingerbread is still the dominant Android dessert with a 58.6 percent share. Rounding out the mix, we've got Android 2.2 Froyo at 27.8 percent, Android 2.1 Eclair at 7.6 percent, Android 1.6 Donut at one percent and Android 1.5 Cupcake at 0.6 percent.
Overall there's not anything terribly surprising to be found in this month's numbers, as shares of older (Froyo and earlier) versions of Android continue to drop and Android 2.3 keeps growing as devices come to market with it preinstalled and existing devices are updated. It'll be interesting to watch the growth of Android 4.0 over the coming months as manufacturers begin to load ICS onto both their current products and upcoming models that aren't yet released, so be sure to stay tuned for that. And now we have to ask, which version of Android are all of you currently running?